

Let’s cut through the jargon. Media Mix Modeling isn’t an arcane ritual performed by data priests.
At its heart, it’s a statistical attempt to answer the eternal marketing question: “What actually worked?”
For years, the industry sold a binary fantasy. You were told to pick one modeling philosophy, one engine, and hope it captured the chaotic beauty of your real-world campaigns.
That era is over. The recent acquisition of MMM Labs by ScanmarQED highlights the end of this “false choice.”
We’re now in the age of the multi-engine approach. The smart assumption isn’t that one model is holy. Truth often lies in the consensus of several.
Think of it less like trusting a single scout’s report and more like synthesizing intel from your entire coaching staff.
Before a single line of code is run, you need the right foundational assumptions. Remember the first law of data thermodynamics: garbage in, gospel out.
Data Assembly (Spend, Impressions, Seasonality, Schedules)
Forget the fancy algorithms for a moment. The real magic of Media Mix Modeling happens in the spreadsheet trenches. It’s not like a Hollywood montage where numbers magically align. It’s more like piecing together a crime scene from scattered evidence. Your model’s smarts depend on the data you give it.
Think of data assembly as building a model based on measurements. It’s the behind-the-scenes work where data is collected, integrated, and analyzed. Without this step, you’re lost. But get it right, and you find your way to hidden treasures.

- Spend Data (The “Easy” Part): This is your financial record. How much did you spend on each ad? It should be clear, but often comes in different formats. Digital platforms offer detailed data, while traditional media gives bulk invoices. Your job is to make it all one financial language.
- Impression Data (The Messy Reality): Here, data science meets spreadsheet work. An impression on TikTok is different from one during the Super Bowl. Platforms measure differently. You’re not just collecting numbers—you’re making them speak the same language. This connecting performance and fan behavior requires understanding what an impression means for your audience.
- Seasonality Curves (The Context Layer): Does your business boom during playoffs? Slump in summer? Seasonality is your market’s rhythm. It’s the excitement of draft day and the quiet of championship week. Ignoring it is like analyzing fashion trends without knowing it’s winter. You must chart these ebbs and flows to see your marketing’s true impact.
- Broadcast & Digital Schedules (The Cause Timeline): When did your ads run? This is your timeline of cause and effect. Major events or competitor campaigns must be logged. Without this, your model is lost, unsure why sales changed. It links spend to actual airtime and screen time.
The goal isn’t to dump data. It’s to create a clear timeline of cause and effect. You’re like an archaeologist, not an accountant. Each data point must be placed on a timeline.
Why does this matter? A model with dirty data is just expensive for confirming biases. Garbage in, gospel out. The insights you get will be beautifully wrong. For more on this, our Media Mix Modeling guide goes into detail.
This assembly process is the foundation of every great insight. It turns raw numbers into a story. Your spend optimization decisions rely on this. Skip this step, and your analysis will fall apart.
So, embrace the spreadsheet. Find the rhythm in the receipts. This disciplined assembly is what makes Media Mix Modeling strategic, not just guessing. It turns data chaos into clear decisions.
Model Specification (Adstock, Saturation, Priors)
Model specification is like starting to cook with your ingredients. The recipe you choose can make your dish amazing or just okay. It’s the heart of Media Mix Modeling, turning marketing spend into real results through three key ideas.
Adstock is like marketing’s echo. A TV ad’s impact doesn’t disappear right away. It keeps affecting sales for days or weeks. Adstock measures this ongoing effect.
Saturation is about getting the most from your budget. Spending more on social media might work at first. But soon, you’re just wasting money. Finding when to stop is very valuable.
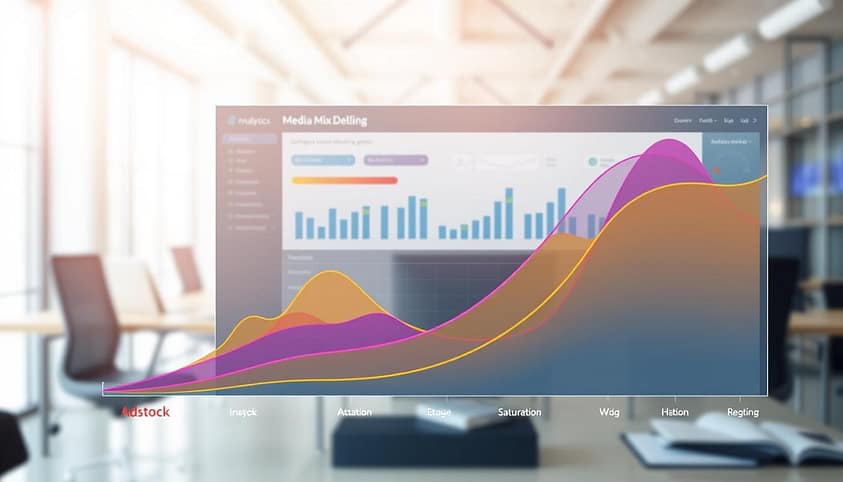
Priors are your smart guesses before seeing the data. They’re part of Bayesian models. They help you use what you already know, like how fast radio ads work.
This leads to a debate between Frequentist and Bayesian methods. Frequentist models, like Robyn, focus on the data you have. Bayesian models, like in PyMC, start with your beliefs and update them with new data.
Marketers use both methods. This way, you get a detailed analysis from both sides. When they agree, you’re sure. When they don’t, you know to check your assumptions.
Using both methods is smart. It’s like having two experts review the same data. You get a complete picture, not just one view.
This approach is not just theoretical. It’s practical. Using both Bayesian models and Media Mix Modeling makes your plan stronger. It adapts to changes and doesn’t fall apart when things don’t go as planned.
Reading the Outputs (ROAS, Response Curves)
The model gives you a number. But don’t celebrate just yet. That ROAS figure is like a quarterback’s passer rating—it’s impressive but needs context.
Is a 3.5x ROAS good? The answer is it depends. It depends on your baseline and the curve behind it. This phase of Media Mix Modeling is about understanding your marketing’s full story.
Your marketing channel is like a muscle. At first, spending money grows your results linearly. But, like a gym membership, there’s a point where more money doesn’t double your results. You hit a plateau.
The real magic is the response curve. It shows where your spending is. Are you in the efficient phase or the saturation zone?
Reading these outputs is an art. A high ROAS might look great, but it could warn of overspending. That money could boost another channel’s growth.
A modest ROAS on a growing channel is a golden ticket. It shows huge untapped growth. A small budget increase could lead to big results.
This is why MMM outputs start a conversation with your budget. They show what you got last quarter and what’s possible with a shift in spending. It moves from “How did we do?” to “What’s possible?”
For a deeper dive into setting up this analytical framework, our foundational guide to Media Mix Modeling is essential. The curve is the narrative. The ROAS is just a single data point in that story. Your job is to read the plot.
Budget Reallocation Scenarios
With your model’s insights, you’re no longer guessing. You’re playing financial chess with the market’s rules. This is when Media Mix Modeling becomes your pre-game strategy. You move from “what happened” to “what if.”
Think of your response curves as a playbook. They show how each marketing channel reacts to more or less investment. The question is: how do you redeploy your pieces for maximum impact?
Let’s get tactical. What if you take 20% from that underperforming traditional broadcast campaign and put it into digital video? The model doesn’t just give you a new ROAS number. It simulates the entire chain reaction. You see the opportunity cost of every dollar shifted.
That shiny new podcast sponsorship looks tempting. But is it the best use of capital? Your Media Mix Modeling simulation can tell you if those dollars would work harder somewhere else. This is strategic spend optimization in its purest form.
We build scenarios not as wild guesses, but as grounded simulations. It’s like having a financial crystal ball powered by your own historical data. You test assumptions. You stress-test budgets. You find the sweet spot where marginal returns are maximized.
The goal isn’t optimization for its own sake. It’s about moving the needle on actual business goals. Are you driving ticket sales? Boosting merchandise revenue? Increasing qualified fan engagement? Your reallocation strategy should be laser-focused on these outcomes.
Sometimes the insights are counterintuitive. Maybe social media needs less love, not more. Perhaps radio packs an unexpected punch in your specific market. The model cuts through industry hype and reveals what actually works for your brand.
This is where you confidently reallocate your marketing budget with. You’re making decisions backed by statistical evidence, not just last quarter’s gut feeling. It transforms marketing from a cost center into a precision investment engine.
True spend optimization through Media Mix Modeling means every dollar has a mission. And every reallocation is a calculated move toward checkmate.
Implementation Roadmap and Governance
Creating a top-notch Media Mix Modeling system is like choosing a star quarterback. The real victory comes from the coaching and strategy.
Your model needs a clear plan. Who will manage it? How often will it be updated? Governance is key here. It’s like the structure of your marketing team’s front office.
More companies are choosing to manage their insights in-house. They want to own their data, not rely on a third-party service. Your Media Mix Modeling should guide all decision-making.
The right mix is essential. You need advanced technology, like PulseQED’s platform and MMM Labs’ engines. You also need analysts who understand both marketing and math. Regular updates are a must.
Bayesian models excel in this structured environment. They turn marketing into a proven growth driver.
Begin with a small test to show its value. Then, expand to make evidence-based decisions a part of your culture. Create a strategy that lasts, not just for one season.
This isn’t just about numbers. It’s about building a marketing brain that learns, adapts, and boosts business growth.